In this blog post, we'll dive into the critical role of application observability in maintaining optimal performance and uptime. We'll explore how it works, why it's essential, and how it transforms challenges into opportunities for growth and improvement. So, if you're looking to elevate your application's performance and reliability to new heights, you're in the right place. Let's embark on this journey together, towards a future where every application operates at its best, driving your business forward with every click, swipe, and interaction.
In the digital age, the heartbeat of every business is its applications. Whether it's facilitating internal operations or serving customers directly, applications are the workhorses that keep businesses running smoothly and efficiently. But what happens when these workhorses stumble? Slowdowns, downtime, and glitches not only frustrate users but can also lead to significant revenue loss and damage to your brand's reputation. This is where the importance of application performance and uptime shines brightest; they're not just IT metrics—they're business imperatives.
Enter application observability, the superhero toolkit designed to not just watch over your applications but to give them a voice. Imagine being able to hear your application's performance story, understand its challenges, and even anticipate problems before they impact your users. That's the power of observability. It's not just about keeping the lights on; it's about turning the spotlight on how your application lives and breathes in the wild. By embracing observability, businesses can ensure their applications perform at their peak, delivering seamless experiences to users and keeping the digital pulse of their operations strong and steady.
Understanding application observability
Definition of application observability
At its core, application observability is the capability to introspect and understand the internal state of your applications by examining their outputs. It's a holistic approach that goes beyond mere data collection; it's about gaining actionable insights into how applications behave and perform in various scenarios. Observability enables teams to answer not just the "what" and "when" of incidents but also the "why" – why an issue occurred, why performance dipped, or why users are experiencing difficulties.
Key differences between observability and monitoring
While often used interchangeably, observability and monitoring are distinct concepts that complement each other. Monitoring involves collecting and analyzing data to keep track of system states and alerting teams when predefined thresholds are crossed. Think of monitoring as the dashboard in your car, displaying critical information like speed, fuel level, and engine warnings.
Observability, on the other hand, equips you with the tools to explore and diagnose the unknowns. It's like having a mechanic riding along with you, capable of understanding why the engine light came on and what can be done about it. While monitoring alerts you to problems, observability helps you understand the root cause and broader impact of those problems.
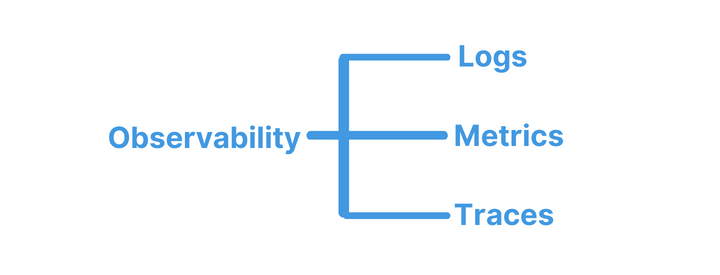
The three pillars of observability: Logs, metrics, and traces
To fully harness the power of observability, it's essential to lean on its three foundational pillars: Logs, Metrics, and Traces. Each pillar provides a unique lens through which to view your application's performance and health. These pillars will be explained in next section.
Why application observability is essential
The role of observability in proactive problem-solving
In the fast-paced world of digital services, waiting for a problem to occur before addressing it is a strategy doomed to fail. This reactive approach can lead to downtime, frustrated users, and lost revenue. Observability shifts the paradigm from reactive to proactive, enabling teams to identify and solve problems before they impact the user experience.
With comprehensive observability, you can detect anomalies, trends, and potential issues in real-time. This early detection allows for swift action, often automating responses to common issues before they escalate. Whether it's scaling up resources in response to increased load or identifying a slow database query affecting performance, observability empowers you to keep your applications running smoothly.
How observability contributes to improved customer experiences
Today's users have high expectations for digital experiences. They demand fast, reliable, and seamless interactions, regardless of the complexity behind the scenes. Observability plays a crucial role in meeting these expectations by ensuring that any potential disruption can be quickly identified and addressed.
By monitoring user journeys and application performance in real-time, you can understand exactly what your users are experiencing. This insight allows for targeted optimizations, ensuring that your application not only functions correctly but also delights your users. Observability ensures that performance issues, no matter how small, are caught and rectified, often before users even notice there was a problem.
Observability's impact on decision-making and operational efficiency
In the data-driven age, the ability to make informed decisions quickly is a significant competitive advantage. Observability provides a wealth of data about your application's performance and the behavior of its users. This data is not just for troubleshooting; it's a goldmine for strategic decision-making.
Understanding how your application performs under various conditions can guide everything from infrastructure investments to feature development priorities. Observability enables you to identify underutilized resources for cost optimization, understand feature usage for better product development, and spot emerging trends that could affect your application's future requirements.
Moreover, by automating routine monitoring tasks and leveraging AI-driven insights, observability can significantly increase operational efficiency. Teams spend less time firefighting and more time innovating, directly contributing to the business's bottom line.
In a landscape where applications are the lifeblood of business, observability is not just a technical necessity; it's a strategic imperative. It enables proactive problem-solving, enhances customer experiences, and informs critical business decisions, all while improving operational efficiency. As we delve deeper into the era of digital transformation, the role of observability in sustaining and driving business success becomes ever more apparent.
Components of an effective application observability strategy
Logs: Understanding the story behind your application's operation
Logs are essentially the narrative of your application. Every action, error, and transaction is logged, creating a chronological record of events. This granularity allows developers and operations teams to go back in time to understand what happened before, during, and after an incident. Analyzing logs can reveal patterns and anomalies that may not be evident from metrics alone. It's like reading a detailed diary entry that explains the sequence of events, offering clues on where things went awry.
Metrics: Quantifiable data that indicates the health and performance of applications
Metrics provide the numerical heartbeat of your application. These quantifiable data points cover everything from CPU and memory usage to request latency and error rates. Monitoring metrics over time helps in identifying trends that could indicate underlying issues. For example, a sudden spike in CPU usage could signal an inefficiency in the code or an external attack. Metrics offer a high-level overview, allowing for quick assessments of an application's health and guiding where to look more deeply.
Traces: Following the journey of requests through the application to identify bottlenecks or failures
Traces give insight into the application's operational flow, tracking the path of requests as they move through various services and processes. This visibility is invaluable in a microservices architecture, where a request might traverse multiple services before completion. Tracing helps identify slow points, failures, and bottlenecks by providing a step-by-step map of the request’s journey, making it easier to pinpoint where delays or errors occur.
Importance of a unified view for troubleshooting and analysis
While each pillar offers valuable insights on its own, the real power of observability comes from integrating logs, metrics, and traces into a unified view. This holistic perspective allows teams to correlate data across different dimensions, facilitating faster troubleshooting and more effective analysis. For instance, an error log can be cross-referenced with a spike in latency metrics and traced to a specific service or database query, streamlining the diagnostic process.
An effective observability strategy doesn’t stop at collecting and analyzing data; it’s about leveraging that data in a cohesive, actionable manner. By maintaining a unified view that combines logs, metrics, and traces, organizations can achieve deeper insights, faster resolution times, and ultimately, higher application performance and reliability.
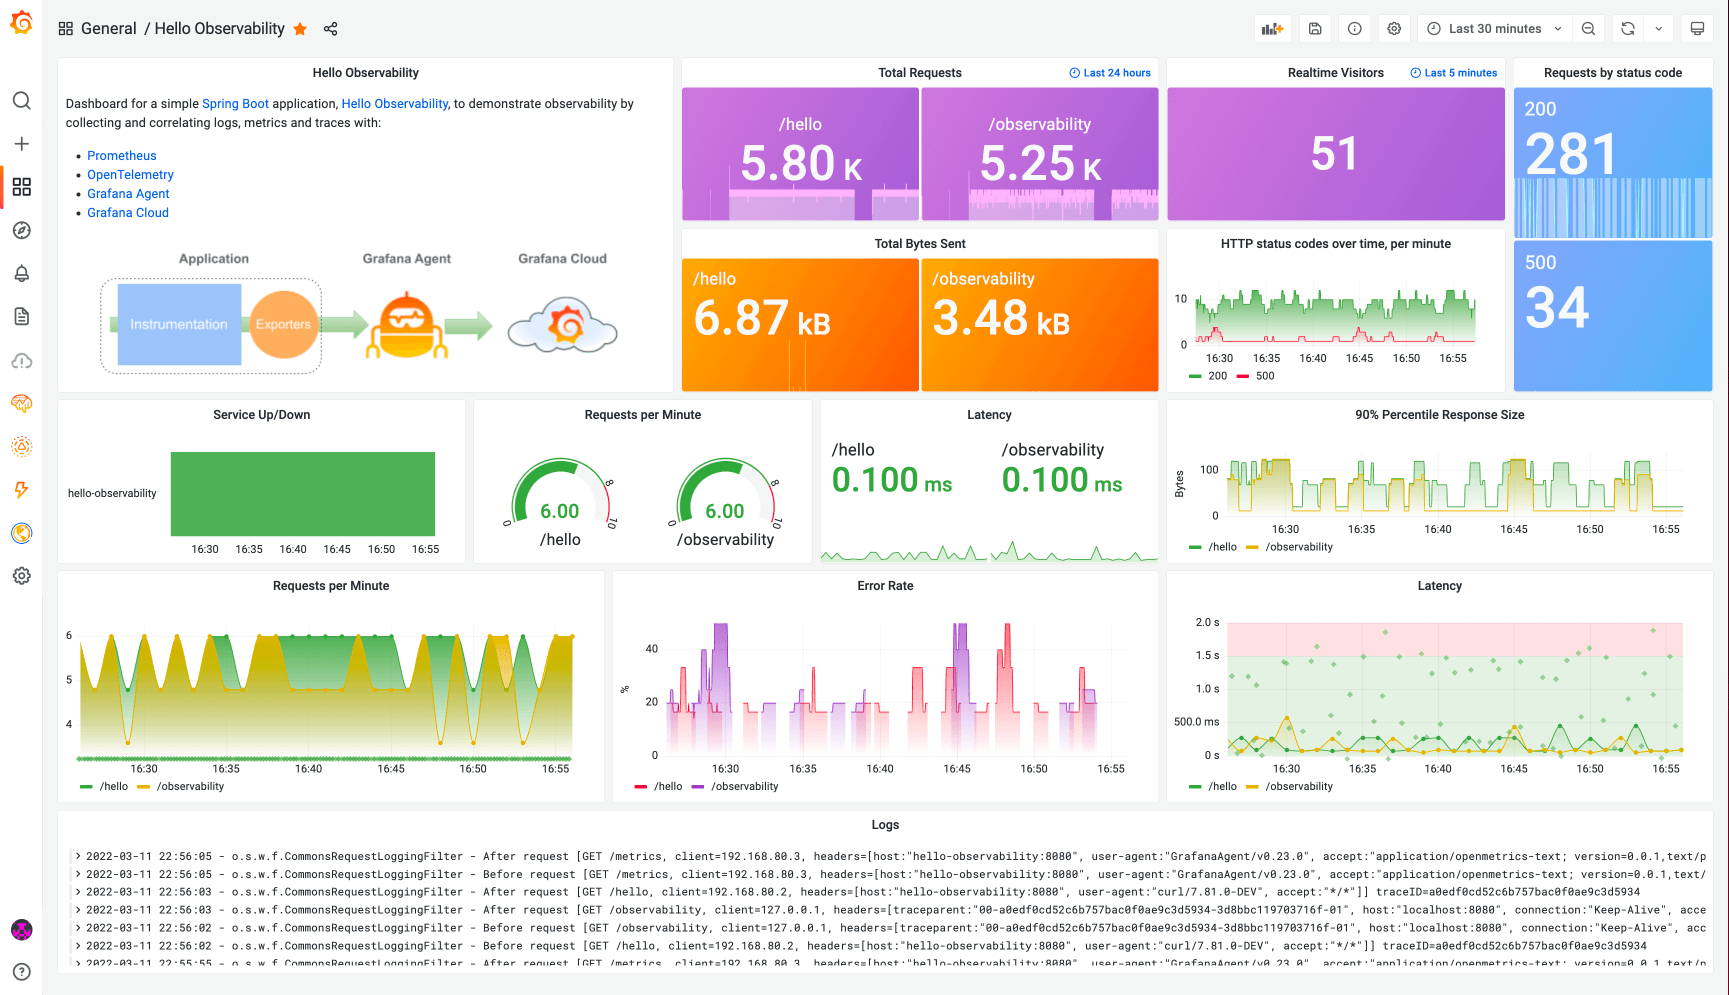 Image source: Grafana
Implementing application observability
Choosing the right tools and platforms for observability
The landscape of observability tools and platforms is vast and varied, with options ranging from open-source projects to comprehensive commercial solutions. The key to selecting the right tools lies in understanding your specific needs, including the scale of your operations, the complexity of your applications, and your team's technical capabilities. Consider tools that offer integrations across the three pillars of observability (logs, metrics, and traces) to provide a unified view of your systems. Additionally,assess the ease of use, scalability, and support offered by the vendor to ensure the tool can grow with your needs.
Integration with existing IT infrastructure and workflows
For observability to deliver its full value, it must be deeply integrated into your existing IT infrastructure and workflows. This means ensuring that observability tools can collect data from all relevant sources, including cloud platforms, on-premise servers, and third-party services. It also involves embedding observability into the development lifecycle, from coding and testing to deployment and operations. Automation plays a crucial role here, enabling the automatic collection of logs, metrics, and traces without manual intervention. Consider using APIs, SDKs, and middleware to facilitate this integration and ensure that observability data is accessible and actionable within your existing tools and processes.
Training teams and fostering a culture of observability
Implementing new tools and technologies is only half the battle; the other half is ensuring your team has the skills and mindset to leverage them effectively. This requires dedicated training and education on the principles of observability, as well as hands-on experience with the tools and platforms you've chosen. But beyond training, fostering a culture of observability is about encouraging curiosity, experimentation, and continuous learning. It means moving away from a reactive posture, where teams scramble to fix problems after they occur, to a proactive approach that values foresight and prevention. Encourage teams to share insights, learn from incidents, and continuously refine their understanding of the systems they oversee. Observability should be seen not just as a set of tools, but as a fundamental aspect of how your organization approaches problem-solving and innovation.
By thoughtfully selecting tools, integrating them into your existing systems, and cultivating a culture that embraces observability, you can unlock deeper insights into your applications and infrastructure. This not only enhances your ability to maintain high performance and reliability but also empowers your teams to drive continuous improvement across all aspects of your operations.
Best practices for maximizing uptime and performance
Continuous monitoring and real-time analytics
The cornerstone of maintaining high uptime and performance is the ability to monitor your applications continuously. This involves tracking key metrics and logs in real-time, enabling you to spot and respond to issues as they occur, often before they impact users. Real-time analytics play a critical role in understanding current system behaviors, identifying trends, and predicting potential problems. Implementing tools that offer these capabilities ensures that you're always ahead of the curve, maintaining smooth and efficient operations.
Setting up alerts and automated responses for potential issues
Alerts are your first line of defense against downtime. By setting up smart, context-aware alerts, you can be notified of anomalies and potential issues before they escalate. However, beyond just receiving alerts, implementing automated responses can significantly reduce the time to resolution. Automation can range from simple tasks like restarting a service to more complex workflows that require coordination across multiple systems. The goal is to minimize human intervention, making issue resolution faster and more efficient. Check out our blog post on Optimizing your website's health: A comprehensive guide to monitoring alerts. for more detailed info.
Regularly reviewing and optimizing observability metrics and logs
The data you collect through observability is a goldmine of insights, but its value is only realized through regular review and optimization. This means continuously evaluating the metrics and logs you're collecting to ensure they're relevant and actionable. It also involves tuning your observability tools to reduce noise, ensuring that teams can focus on the signals that matter most. By regularly refining your observability strategy, you can enhance its effectiveness and ensure that your monitoring efforts are always aligned with your operational goals.
Incorporating feedback loops between observability insights and application development
One of the most powerful aspects of observability is its ability to inform and improve the development process. By establishing feedback loops between the insights gained from observability and your application development teams, you can drive continuous improvement. This could mean identifying performance bottlenecks that need to be addressed in the code, or spotting user experience issues that require design changes. Integrating observability into the development lifecycle ensures that your applications are not only built to perform but also continuously optimized based on real-world data.
 Leveraging WebGazer for enhanced monitoring
In the quest to maximize uptime and performance, solutions like WebGazer offer a streamlined approach to monitoring your digital assets. With continuous monitoring and real-time analytics, WebGazer helps businesses stay on top of their application health, ensuring high availability and seamless user experiences. What's more, setting up alerts and benefiting from automated incident detection takes the guesswork out of maintaining system reliability.
For those looking to elevate their application observability, WebGazer is offering a 7-day free trial, allowing you to experience the benefits firsthand. By integrating WebGazer into your observability strategy, you gain an ally in your mission to maximize uptime and optimize performance, backed by a suite of tools designed to keep you informed and in control.
In embracing these best practices and integrating solutions like WebGazer, businesses can ensure their applications are not just operational but thriving, driving satisfaction and success in the digital age.
As we reach the conclusion of our exploration into application observability,it's clear that this discipline is not just a luxury but a necessity for modern businesses aiming to maximize uptime and performance. Throughout this blog post, we've delved into the essence of observability, distinguishing it from traditional monitoring, and highlighted its three foundational pillars: logs, metrics, and traces. We've also covered the critical steps for implementing an observability strategy and shared best practices that can help ensure your applications run smoothly, efficiently, and without interruption.
The journey toward full application observability is both a strategic and technical endeavor, requiring not only the right tools and technologies but also a shift in culture and processes. By adopting observability practices, businesses can gain unprecedented insights into their applications' inner workings, enabling proactive problem-solving, enhancing customer experiences, and making informed decisions that drive operational efficiency.
We strongly encourage businesses of all sizes and industries to evaluate their current observability strategies. In many cases, there's significant room for improvement, whether it's integrating more comprehensive monitoring tools, refining alert systems, or simply fostering a culture that values data-driven decision-making.
For those looking to embark on or enhance their observability journey, WebGazer offers specialized monitoring solutions that can help elevate your understanding and management of application performance and uptime. With a suite of tools designed for the modern digital landscape, WebGazer provides continuous monitoring, real-time analytics, and actionable insights that can transform the way you oversee your digital operations.
Consider taking advantage of WebGazer's 7-day free trial to experience firsthand the impact of advanced observability on your business operations. It's an opportunity to see how seamless and effective monitoring can be, with minimal setup and immediate benefits.
FAQ: Understanding Application Observability
What is application observability?
Application observability is the capability to introspect and understand the internal states of applications by examining their outputs. It involves gathering actionable insights into application behavior and performance, enabling teams to not just know when something went wrong, but also why.
How does observability differ from monitoring?
Monitoring is about collecting and analyzing data to keep track of system states and alerting teams when certain thresholds are crossed. Observability goes a step further by providing the tools to explore and diagnose the root causes of observed issues, offering a deeper understanding of system behavior.
What are the three pillars of observability?
The three pillars of observability are logs, metrics, and traces. Logs provide a detailed textual record of events, metrics offer quantitative data on system performance, and traces map the journey of requests through an application’s architecture.
Why is application observability essential?
Application observability is essential for proactive problem-solving, improving customer experiences, making informed business decisions, and enhancing operational efficiency. It enables teams to detect and address issues before they affect users and helps optimize applications for better performance.
How can I implement application observability?
Implementing application observability involves selecting the right tools that offer integration across logs, metrics, and traces, integrating these tools with your existing IT infrastructure and workflows, and training your team to effectively use these tools. Cultivating a culture that values observability is also crucial.
What should I look for in observability tools?
Look for observability tools that provide comprehensive coverage of logs, metrics, and traces, offer real-time analytics and automated responses, and integrate seamlessly with your existing systems. Usability, scalability, and the level of support provided are also important factors.
How can WebGazer help with monitoring my applications?
WebGazer is a powerful monitoring tool that helps ensure your applications are always up and performing well. It specializes in uptime monitoring, cron job monitoring, and status pages, offering real-time alerts and insights into your application's health. With WebGazer, you can proactively address potential issues before they impact your users, making it an essential component of a broader application performance management strategy.
Is there a trial available for WebGazer’s monitoring solutions?
Yes, sign up to start offers a 7-day free trial, allowing you to experience the benefits of robust application monitoring without any initial commitment. This trial period is an excellent opportunity to see how WebGazer can enhance your existing monitoring and observability strategies, providing valuable insights into your application's uptime and performance.